|
|
|
HIS Color Space, Principle Component Analysis
and Arithmetic Modeling Operations
by : Idung Risdiyanto
MIT Student / Biotrop
1999
![]()
![]()
![]()
Abstract
When we will interpretation data from image sensing, we need the information not in one image, but we must to explore on the other image. Therefore, if we use two or more image dataset and their have different source we must to create integration of their data. For example, we have the Landsat TM image and SAR image for the same temporal and area, and then we want to explore any information from their data, so, we need to integration a both data. Use the data integration may get the information more detail. Therefore, in this assignment we will learn about the integration using several techniques like as HIS color space, PCA and arithmetic modeling. Objective of assignment are learning to create data integration through HIS color space, principle component analysis and arithmetic modeling operations. Refer from path of introduction, background, procedures and discussion we can make the conclusion.
The
datasets will be integration must be to have the same coordinate, large and data
type of value, if data not same, impossible to make data integrations.
Before we create data integration we must to make data prepare, its mean
to produce available dataset to integration.
In this assignment, the dataset have been integration with SAR imagery is
Landsat TM, Thematic dataset and NDVI dataset.
For thematic dataset produced by ISOCLASS unsupervised classification and
the NDVI dataset produced from the equation of Landsat TM to NDVI.
We have been learning data integration using IHS transformation and the data sets to be use with and without PCA. Using IHS transformation can closely approximates with the human vision so the system better than RGB system. Data integration uses the data result from PCA relatively better than the data without PCA, although several PCA combination can be produce good image like as PC456. Use PCA we can reduce the inter band correlation to be cause the confusing information.
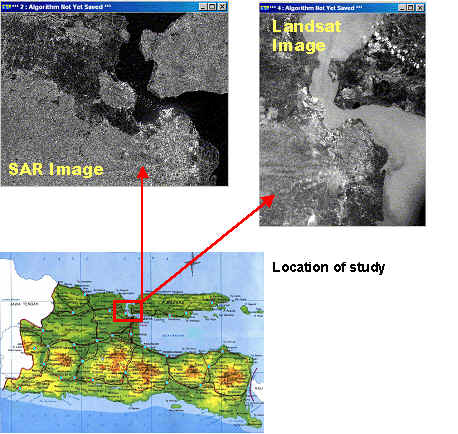
The study are can be shown in this figure.
![]()
![]()
![]()
![]()