|
|
|
Understanding NOAA Satellite Data
by : Idung Risdiyanto
MIT Student / Biotrop
1999
![]()
![]()
![]()
![]()
Introduction
|
|
NOAA
is one of satellites that give fast information to monitoring and manage the
natural resources or activities.
It use to detected forest fire by hot spot, cloud moving, vegetation
index, so that so many department or person use it to they project.
NOAA satellite have been design as polar orbiting environmental
satellites (POES), because that, much subject about environmental use it, as
meteorology and climate, natural resources management, agriculture,
oceanography, geophysics, fisheries and etc.
Now, NOAA data set is most popular remote sensing data and so many to be
using.
This data can be get free or not pay using own satellite receiver or via
Internet.
NOAA
Satellite Characteristic
NOAA
Satellite is the meteorological satellite and launch by National
Oceanic and Atmospheric Administration (NOAA)
and (National
Aeronautics & Space Administration
(NASA). NOAA satellites have 16
families and use the Advanced
Very High Resolution Radiometer
(AVHRR) since NOAA-6. Now, NOAA satellite that often use is NOAA 12 and NOAA 14.
This satellite have characteristic as below table.
Generally the important characteristics for NOAA satellite are spatial
and temporal resolution. It has
daily temporal and 1x1 kilometers spatial resolution. The orbital characteristic cause NOAA satellite has
resolution like as above. These
characteristics cause it to use many applications, especially to general
monitoring. Sometimes, if users
want to more detail information, especially about spatial resolution the users
will combine with information from another satellite, for example Landsat TM or
SPOT satellite. |
Table
Characteristics of NOAA satellite
|
Management |
NOAA
and NASA |
|
Number
of satellite have been launching |
16 |
|
orbit |
Sun-synchronous
polar orbit |
|
Altitude
of orbit |
850
km |
|
Even-
Numbered mission |
daylight
(7:30am) descending equatorial crossings |
|
Odd-numbered
missions |
nighttime
(2:30am) descending equatorial crossings |
|
swath |
3000
km x 6000 km |
NOAA Dataset Characteristic
NOAA dataset is the image often using for much application as above explanation.
This is causing from NOAA dataset characteristic.
This dataset have been familiar with much image processing software as ER
Mapper, IDRISI and the other.
Generally, the dataset that often use by users can divide three type;
they are Local Area Coverage (LAC), Global Area Coverage (GAC) and High
Resolution Picture Transmissions (HRPT).
Each of data type have characteristic as Table 2.2.
Too much application each of dataset will be use different.
For example, to monitor cloud move between big islands in tropical area
maybe enough use GAC data only, but for monitor forest fire on the island
(Sumatra island in Indonesia) maybe we need more high spatial resolution as LAC
and HRPT.
Table of Characteristic of NOAA dataset
|
Type
of Dataset |
Characteristic |
|
Local
Area Coverage (LAC) |
·
Full
resolution data ·
1.0
km resolution at nadir Recorded over an area and then downloaded over ground receiving station. |
|
Global
Area Coverages (GAC) |
·
LAC
data that is resampled ·
lower
resolution = 1.1 ®
4.0 km (nadir) |
|
High
Resolution Picture Transmissions (HRPT) |
·
Full
resolution data ·
1.1
km resolution at nadir Transmitted
to the ground station in real time |
Reference : (O’Brien,
1999)
NOAA
dataset have five Bands and each of bands can be combination to calculate some
objective like as vegetation index or hot spot.
NOAA band has range of wavelength is 0.58 – 12.50 micron.
For more detail can be seen Table 2.3.
Characteristic each of band can use for much application, for example
band 1 use for daytime cloud and surface mapping, band 2 for surface water
delineation, band 3 for sea and land surface temperature and day night cloud
detection, band 4 as same as band 3 and last one bad 5 for sea surface
temperature.
From that explanation we can know the NOAA dataset have the primary
function to monitoring meteorology activity.
Table of the value of NOAA-14 band
|
Channel
or Band |
Value
of wavelength (microns) |
|
Band
1 |
0.58
– 0.68 (Visible Red) |
|
Band
2 |
0.725
–0.10 (Near Infra Red) |
|
Band
3 |
3.55
– 3.93 (thermal Infra Red) |
|
Band
4 |
10.50
– 11.50 (Thermal Infra Red) |
|
Band
5 |
11.50
–12.50 (Thermal Infra Red) |
Generally we have five topics to discussion. Refer from hand out of assignment #2 we will discuss about how well NOAA image fits with DEM after rectification, accuracy error, how the channel hat to be calibrated, temperatur data vs. elevation, application temperatur data could be useful in Natural resource study and about NDVI data. To make our discussion sistemathic, so that will divide five topic. First, about how to get NOAA data, data preparation, temperature data, NDVI data, how about NOAA composite data with DEM.
Brief
Discussion
We can get free the NOAA data by Internet. So, although we don’t have satellite data receiver, but we still use and get NOAA data for our project. The data can get with downloading using FTP connection, but in this assignment we do not do, because time not enough. Size of data depends on how much area will be capture, more large so that the file size more high also. For example in this assignment to capture Java Island dataset we get the file with the value have size 10 – 15 Mb for one data. This data have special format, therefore if we want to process we need import the data to file format that suitable with out software. In this assignment, we use ER Mapper to process, so the original NOAA data must be import to ers file.
Using Internet connection we can order free NOAA data that we want. We can choose area and date the data, so that the NOAA data serve the real time and histories data. The SAA NOAA administrator will send email contain verification and give guideline how we will download NOAA data using FTP address.
One of all problems when we want downloading NOAA data via Internet is velocity of Internet connection. If we low to download NOAA data may the connection will cut by SAA administrator. We have been give 3 x 24 hour to download all data had been our order. This is serious problem, because in Indonesia Internet connection have the low average (16 – 64 bits per second). To loss the problem, we can use simple trick, it is do not much order if the internet connection low, we must consider about it. We can order one by one, its main if we finish one order we can order dataset again.
Data
Preparation
NOAA
Rectification
In the data preparation, we have been many procedures to create the data so that can use for next procedures or application. Preparing data contained import data and rectification. Import data its main changing the original LAC NOAA dataset into ER Mapper format. After import processing we get the fact that the data is opposite, so that we need to rotate. When we rotate maybe will raise the error, but we don’t consider it.
When we rectification the NOAA dataset we use the GCPs collection that have RMS errors is we have RMS is 15.35%. This values enough for NOAA dataset, because this data have low spatial resolution. Otherwise, when determine the point for GCPs on the NOAA image we get difficultly, because NOAA image some where not clearly with by cloud coverage. Dataset of referenced to collect GCPs also influence the accuracy of rectification, because we use the dataset referenced with the low scale (1:1000000). Consider with above recent we could say that our rectification is well, although have high RMS error.
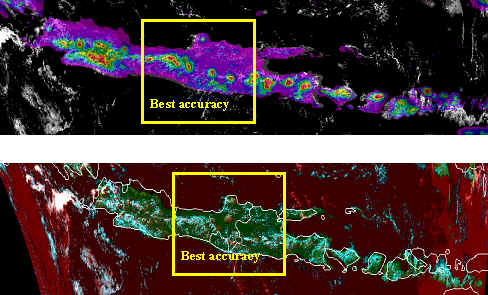
For visualization our accuracy have been overlay the result of NOAA rectification with the vector and DEM dataset. We can see, we get fact that somewhere NOAA image cannot accurate with the data referenced (vector and DEM dataset). When rectification NOAA image have been stretching from original dataset. The rectification dataset allow earth parabola. Refer from it, we can make the result, if we make small area of NOAA image to rectification maybe we will get more accuracy than if we use large area. About it, can see from dataset overlay, on the center NOAA image have more accurate that another place or path with the DEM or vector dataset. Figure as shown this fact.
Calibrated
and converted the channel value
Including in data preparation is calibrated and converted digital number of image data satellite to radiance. We need calibrated it, in order to can calculated the temperature and NDVI. The image after import has the pixel value type is digital number (DN). It number present distribution color on the image only. Otherwise, it is integer number and has number of bits or pixel is 16 bit. We know that DN represents how bright something seems to the sensor.
Temperature and NDVI can calculate if we know about distribution of reflectance energy. Temperature can be get with converted energy value to temperature dataset. Theory in physic, temperatures represent the heat or energy a object, so that one of all equation will be use to converted energy value to temperature is Plank’s radiation equation. We also know that the radiance wavelength is energy parcel and it call photon. Actually the object on the surface will be absorb, transmission and reflectance coming energy and then satellite sensor will receive reflectance energy. When we do image processing, we have been changing reflectance energy to DN value, so that we need convert this value again to get energy value. NDVI also as same as with temperature calculate. The visible red and infrared wave that reflectance by vegetation actually is energy.
Energy coming on the object have characteristic about slope and intercept value. Each of channel have own value, it will use calibrated and converted to get radiance value. Then using radiance value, can calculate the NDVI or temperature. We also application for another using like as VI (Vegetation Index) and Cloud density.
Temperature
information from NOAA satellite
Using radiance value we can get the temperature value. In this assignment we have been combine the temperature data and DEM dataset. This combination has objective to understanding the relations between temperature and elevation. Refer from climatology theory; temperature is one of all meteorology elements. It value influence by another element and climate factors. One of all climate factors is altitude or elevation and other is geo position (latitude and longitude), distribution of continental and season. Actually, temperature in tropical area influence by climate factors is elevation from sea surface.
Relation between temperature and elevation can explain with DALR theory. DALR is dry adiabatic lapse rate and only use in Troposphere level. If elevation increases 100 meters, temperature will decrease 0.6°C. Otherwise, other theory about it also can use to explanation. Refer from result temperature calculation based on DEM and NOAA temperature dataset; we can see that if elevation increases will decrease temperature. Using rainbow colors table of layer, the high temperature represent red color and low temperature blue color.
Problem when we calculate temperature is cloud coverage. Density of cloud will influence the value will be getting. Thin or bold cloud coverage will cause disturbing radiance reflectance from surface. Actually if atmosphere on the image not clearly will reduction the temperature value.
Temperature information often use in natural resources activity. For example, fisheries subject use sea surface temperature (SST) to analysis where the location has much fish. Using it information, can predict sea current and the result we also analysis fish population will be getting. Other use is fire forest monitoring. Temperature anomaly will be use to predict hot spot. It is points that have high temperature possible causing fire or initialization assign of fire. Like as describing in chapter 2, sea surface temperature useful to predict atmosphere dynamic especially El Nino and La Nina phenomena. SST influences the air pressure on above it and how much the water vapor will be raising, then it conditions will influence the atmosphere dynamic as rain and dry season.
Normalized
Difference Vegetation Index (VDVI)
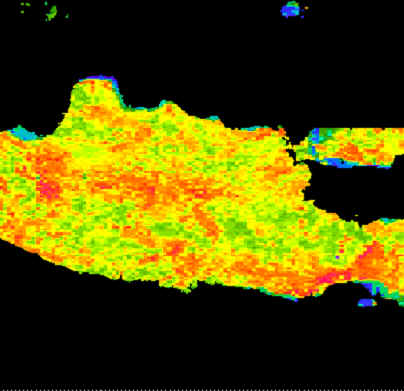
NDVI is index of vegetation represent the type and density the vegetation on the earth surface. It have range value –1 to 1, high value represent high density of vegetation and low value may water, cloud or bare soil. Refer from result of procedures we get NDVI value for all Java island and small area for study. About accuracy, actually we cannot know, because we do not have other parameter as comparison it. To know that accuracy we must to do ground check. Assume we do not need ground check, we can said that the VDVI calculation can give the good value, because to get NDVI we have been making composite image with DEM to reduce value on the sea or other water body (as shown in below figur)
Based on NDVI classified we have been getting over 90% for 0 – 0.5 % NDVI value, this can become fact that our calculation have high accuracy, because some studies had been considered that is the range normal value of NDVI. It is can represent the rice crop, shrubs or forest area. Shrubs and rice crop may have smaller value than forest.
For natural resources study, NDVI have been often using for some application. Land use change evaluation can use NDVI. Increasing and decreasing the forest area can monitor with NDVI from NOAA. The stronger of forest area monitoring using NDVI from NOAA is the area can monitor daily. For more detail, especially for spatial resolution we can combine information using satellite data that have high spatial resolution. NDVI also use to plant growth monitoring as rice crop or other crop specify. To monitoring rice crop we use NDVI value for input and than make integration using modeling technique.
Now, NDVI use to analysis natural resources on the land surface, so that in the future we should think how to implementation NDVI information for Sea area. The considering background about it, in the see also contain the chlorophyll from coral reef, plankton or sea grass. If we consider about it, so that we must to study haw to explore NDVI value for natural resources in the sea.
![]()
![]()
![]()
![]()