|
|
|
Image enhancement, Histogram Manipulation and
Land-Cover Interpretation and Plotting
by : Idung Risdiyanto
MIT Student / Biotrop
1999
![]()
![]()
![]()
Introduction
Each cover type on the earth has a specific characteristic about to absorb, reflect and transmit electromagnetic energy. That fact can different between an object and other’s on the earth surface and then can be using in the remote sensing technologies. Remote sensing satellite record reflected and emitted radiant flux form earth surface object or materials. Differences reflected and emitted each material are wavelength’s. Then the difference was used to know and interpreted what are materials or object on the earth surface. Illustration above statement can be seen in figure 1.
Figure 1. Mechanism electromagnetic energy from energy source to satellite sensor (passive satellite)
According
Jenson (1986), one material would reflect a tremendous amount of energy in
certain wavelength, while another material would reflect a much less energy in
the same wavelength. This would
result in contrast
between two types of materials when record by a remote system.
For example, between water body and land cover by vegetation will give
different flux energy for satellite sensor.
Using typical spectral reflectance curve can be seen that water body will
reflect wavelengths are 0.4 to 0.8mm
and vegetation will reflect wavelengths are 0.4 to 2.6mm
or more. Visualization image also
gives different colour, gradient, texture and pattern.
So, if we are interpreting used image-processing machine, we can change
or make a contrast to get the best visualization so that easier to interpreted.
That process was called image enhancement.
The describe of image enhancement are involves
the creation of an algorithm which alters the display of pixel brightness values
in order to improve the appearance of an image for human visual analysis
(O’Brien, 1999). Because the
processes depend on human, so, output or results are very subjective.
There
two types image-enhancement technique. In
Jenson (1886) two types image enhancement are linear contrast enhancement and
nonlinear enhancement. The linear
contrast enhancement is expands the original input brightness values to make use
total range or sensitivity of the output device.
Then, non linear contrast enhancement derive histogram of the range and
use histogram equalization, the algorithm then passes through the data set and
assigns approximately equal numbers of pixels each of the output.
Histogram equalization applies the greatest contrast enhancement to the
most populated range of brightness value.
Fact, between image enhancement and interpreting are inseparable process, because enhancement process was used to interpret. To know what are materials covers on the earth surface in the digital image we should improve pictorial and digital data. According Lillesand and Ralph (1994), visual interpretation of pictorial image data has long been the workhorse of remote sensing. Visual techniques make use of the excellent ability of the human mind to qualitatively evaluate spatial patterns in a image. The ability to make subjective judgments based on selective image elements is essential in many interpretation efforts. Therefore, we also need knowledge about digital image source by satellite and related subject, especially record band or wavelength by materials reflectance or object.
To help us for image interpreting we can use typical spectral reflectance curve. Its can be seen characteristic electromagnetic wavelength was reflected each cover type on the earth surface. In figure 2, we can see typical reflectance by vegetation, soil and water. Then, to make combination between knowledge about digital image source by satellite and it curve we would interpretation.
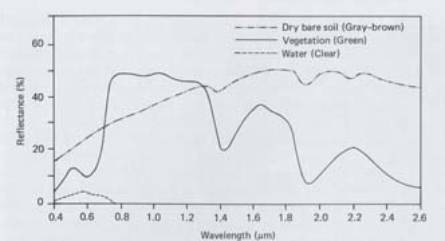
Figure 2. Typical spectral reflectance curve for vegetation, soil and water (Lillesand and Kiefer, 1994)
After we improve image to enhance and interpreted, we need to plot.
The simple describe about plotting are layout result image processing in
the one medium (paper map or display by computer screen), so the image become
useable and the users or another people can be direct use for analyzing and
another. The minimum plotting must
include the enhancement type, scale, projection information, a title and
subtitle describing the plot and location, author and year.
Discussion
The purpose assignment task was image enhancement, manipulation histogram and layout plotting. After corrected image by radiometric and geometric distortion, we need to enhance before we will interpret. Image enhancement was needed, because it will be help us to easy determine which object covered by image.
In
this report, image enhancement was done on several features type on the
earth’s surface. The features are
urban and roads, geological, turbid water, deep clear water, clouds/smoke and
haze, agriculture, natural vegetative cover and bare soil. Before we enhance the
RGB composite band combination image, we begin image enhancement by pseudo
layers. This was important, because
the pseudo layers can be used for basic image enhancement and then after that,
we will enhance the RGB composite band combination image.
Image
enhancement of pseudo layers was using histogram manipulation. The histogram
manipulation was done to move the line transform and change the DN value become
stretch 0 to 255 and change the distribution of DN value become they have normal
distributions. These procedures are manually. Several features type was
difficult to enhancement, because we did not have reference and basic map of the
study area. The difficult features
type to image enhancement are natural vegetative cover and urban/roads.
Band 7 almost can be represented to all features type except for turbid
water (poor) and urban roads (medium). Then
for the band 6 almost can not represented all features except for the natural
vegetation with the ranks is moderate.
Image
enhancement of RGB composite band combination image was using histogram
manipulation as same as with procedure of image enhancement of pseudocolor
layers. To enhance the image we use basic reference from spectral reflectance
curve. In this curve we can
determine the typical spectral by object, so the determining band can be easy.
For example, the chlorophyll of vegetation can reflected the EM energy
from visible light and infrared group, but they have the maximum wave length
reflected on 0.7 – 0.8 mm
then in Landsat 5 satellite sensor the wavelength was received and recorded by
band 4. Therefore if we change
combination band to get vegetative features type we can choose band 4, then to
clearly of the object we also need the compare band, for example we can choose
the band 5 or 7 of the good reflectance wavelength by soil.
In this report, for specific features to image enhancement are overall,
vegetative and urban/roads. For
overall, the band combination can be represent is RGB 741, then for vegetative
is RGB 543 and for urban/roads is RGB 457.
To represent our image we must to design the layout. This path is very important because the good design will be to easier for user to understand our image. The information in our layout, must to include is image title, date of processing, the name of author, site location if the image, sensors satellite type and the RGB band combinations, scale bar and north arrow. The problems were found in plotting layout processing are; we didn’t have information about the site location. Therefore after we interpreted and before plotting we need the ground check study area.
|
Feature
type |
Useful
combination |
Explanation |
|
Urban and roads |
457 |
band 5 and 7 are good reflectance by soil or object non water and vegetation, so for interpretation we compare good reflectance by vegetation and good for soil |
|
Geological |
457 |
Geological features can be represent by topography and layer texture, so similar with urban and road. |
|
Turbid Water |
123 |
It can be representation by sediment water, so, we use band 1 and 2 are good reflectance by water and band 3 more decrease reflectance by water. |
|
Deep and clear water |
125 |
Should be compare good reflectance by water (band 1 and 2) and good reflectance by soil (band 5) |
|
Clouds/smoke/haze |
741 |
Generally, many combinations can be representing it, but all for one of the best is band combination 741 |
|
Agriculture |
741 |
Agriculture in this area are rice-field and cultivate by fish, so agriculture features can be represented by band 4 and 1, and to compare we use band 7 for soil |
|
Natural Vegetative cover |
543 |
Reflectance by vegetative cover are band 3 and 4, so, we can compare these bands with the good reflectance by soil (band 5) |
|
Bare soil |
741 |
to get the feature of bare soil we must to compare soil, vegetative and water, so, we can use band 7 for soil, 4 for vegetative and 1 for water. |
Conclusion
The assignment tasks are image enhancement, manipulation histogram and plotting. For the image enhancement can de divided by three path; pseudo layers image enhancement, found useful band combination for several features type, and image enhancement for specific features type. Then, for the layout plotting was done of the specific features type (overall, vegetative and urban/roads).
Using image enhancement, we can determine the features type with the decrease
probability to make of the mistake interpretation.
The plotting layout was needed, in order to the other people or user can
be used our interpretation and can be understood of our mind about the image.
Thus the assignment was necessary to provide interpretation and explain
of the features type maybe the other people or user will be used our image.
References
Jenson,
J. 1986. Introduction Digital Image Procesing. A Remote Sensing
Prespective. New Jersey : Prentice
- Hall
Lillesand,
T.M and Ralph, W.K. 1994.
Remote Sensing and Image Interpretation (third edition).
John Wiley & Sons, Inc. New York. USA
![]()
![]()
![]()
![]()